


Graphs & trends
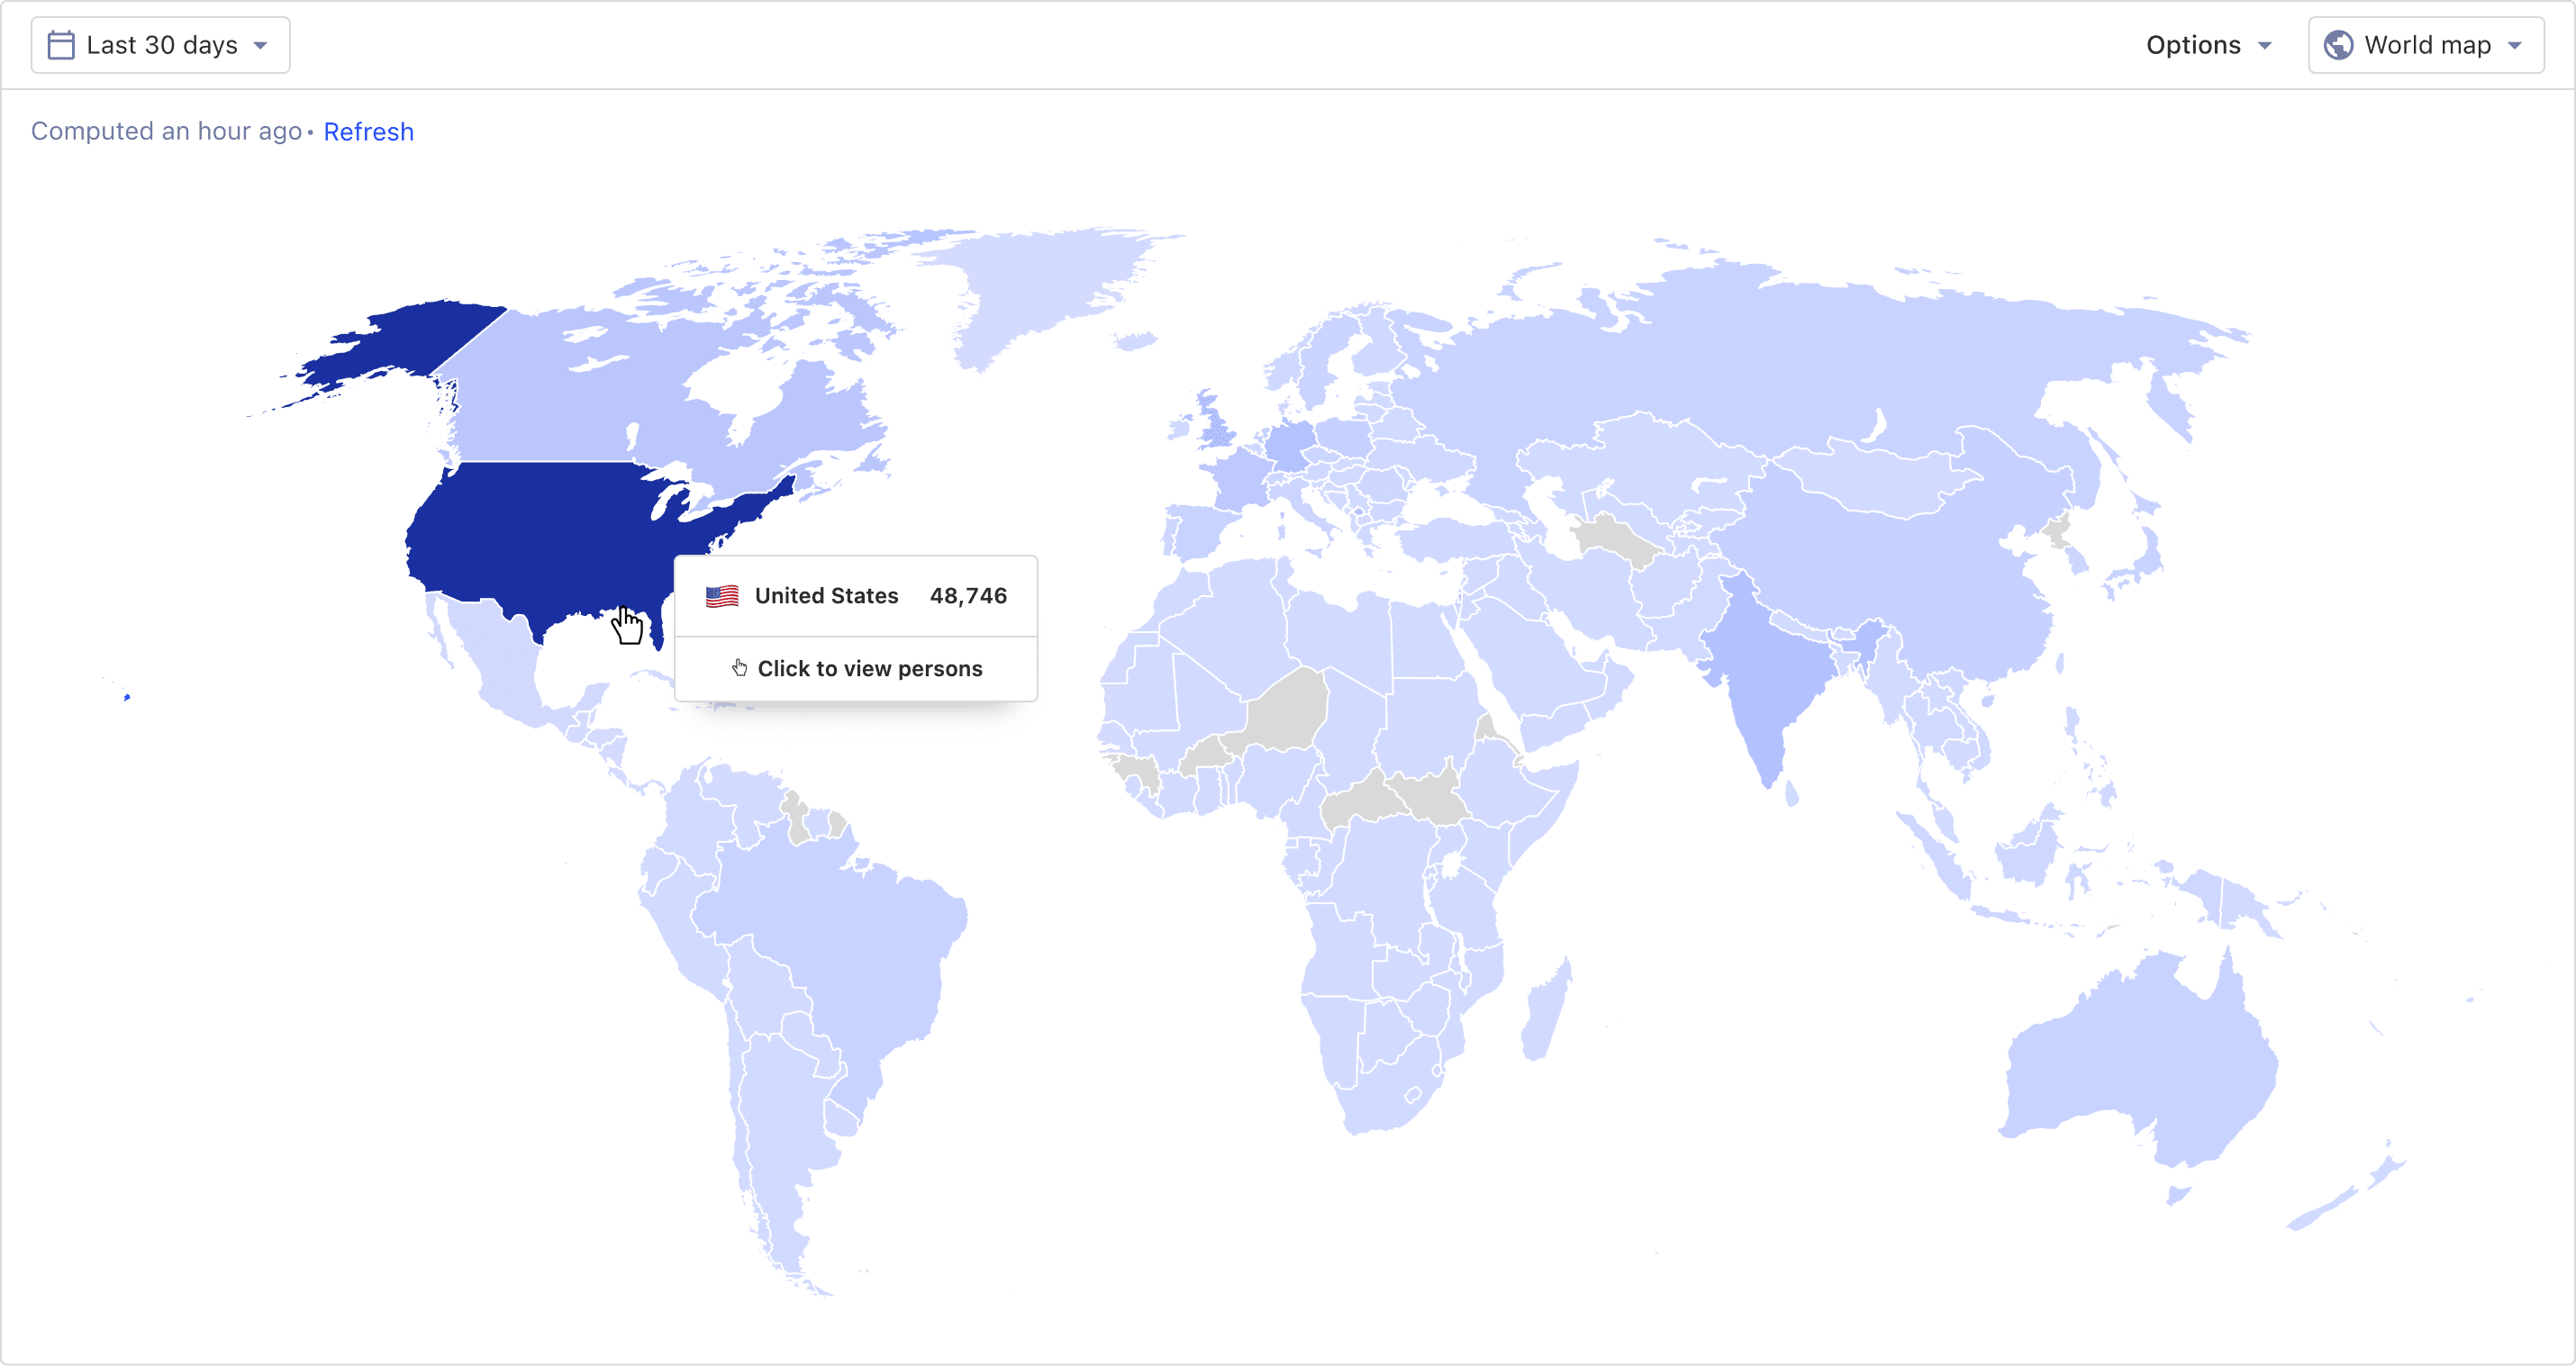
Visualize user data with graphs, tables, charts, maps, and more
Plot any event over time, apply advanced filtering, and break down by any property.
Features
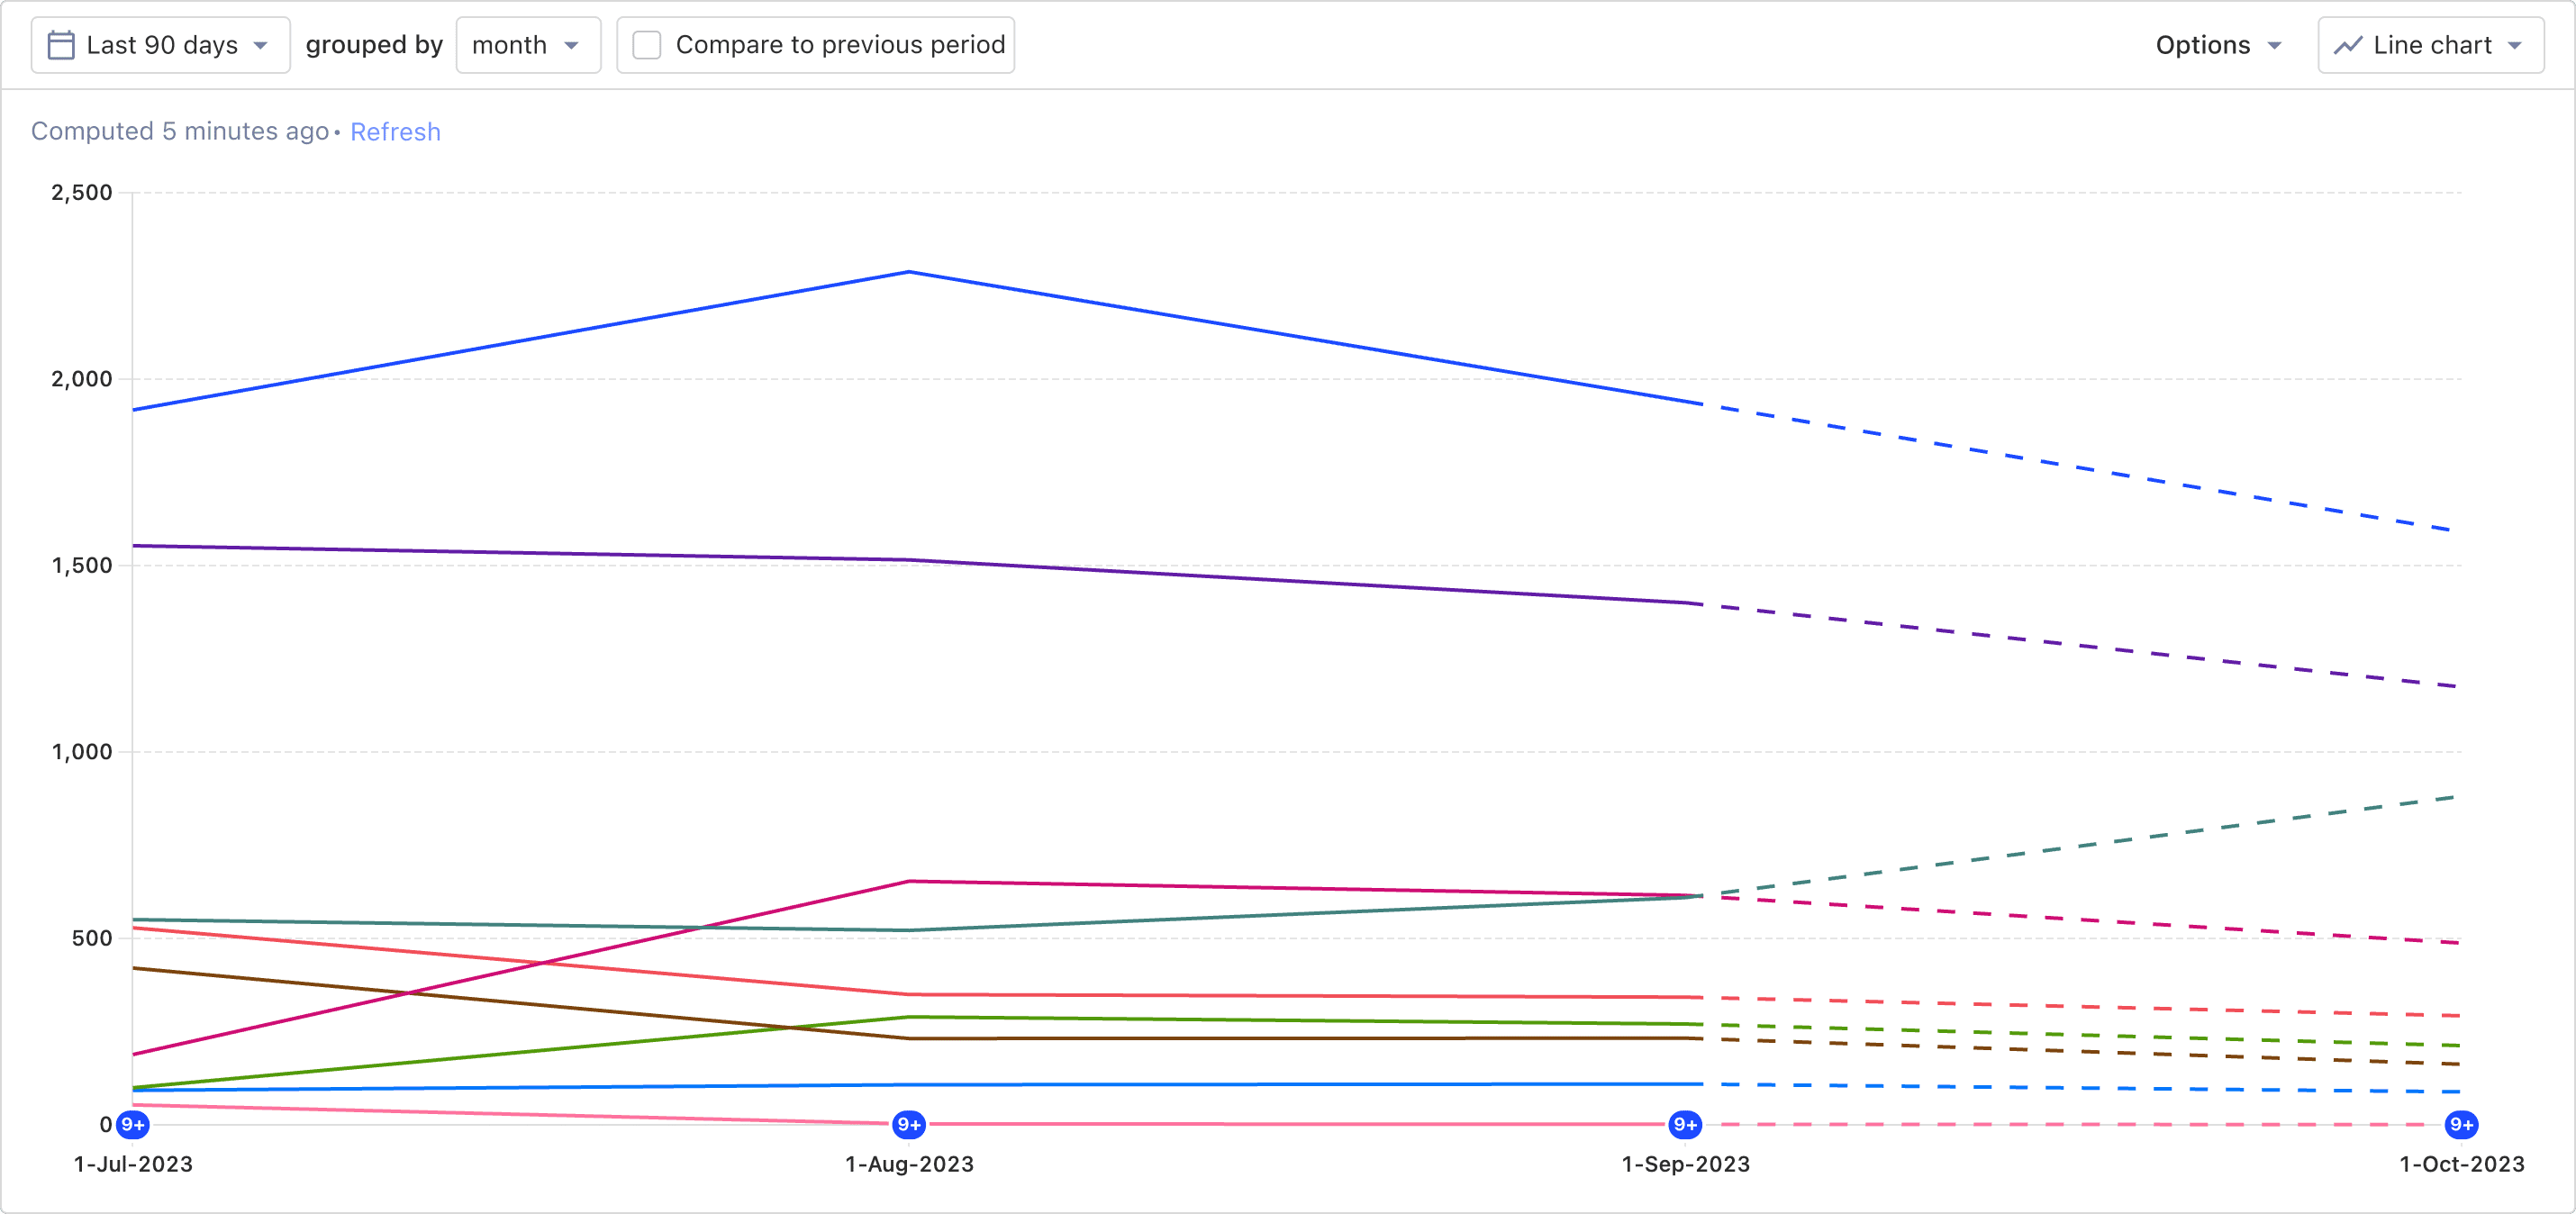
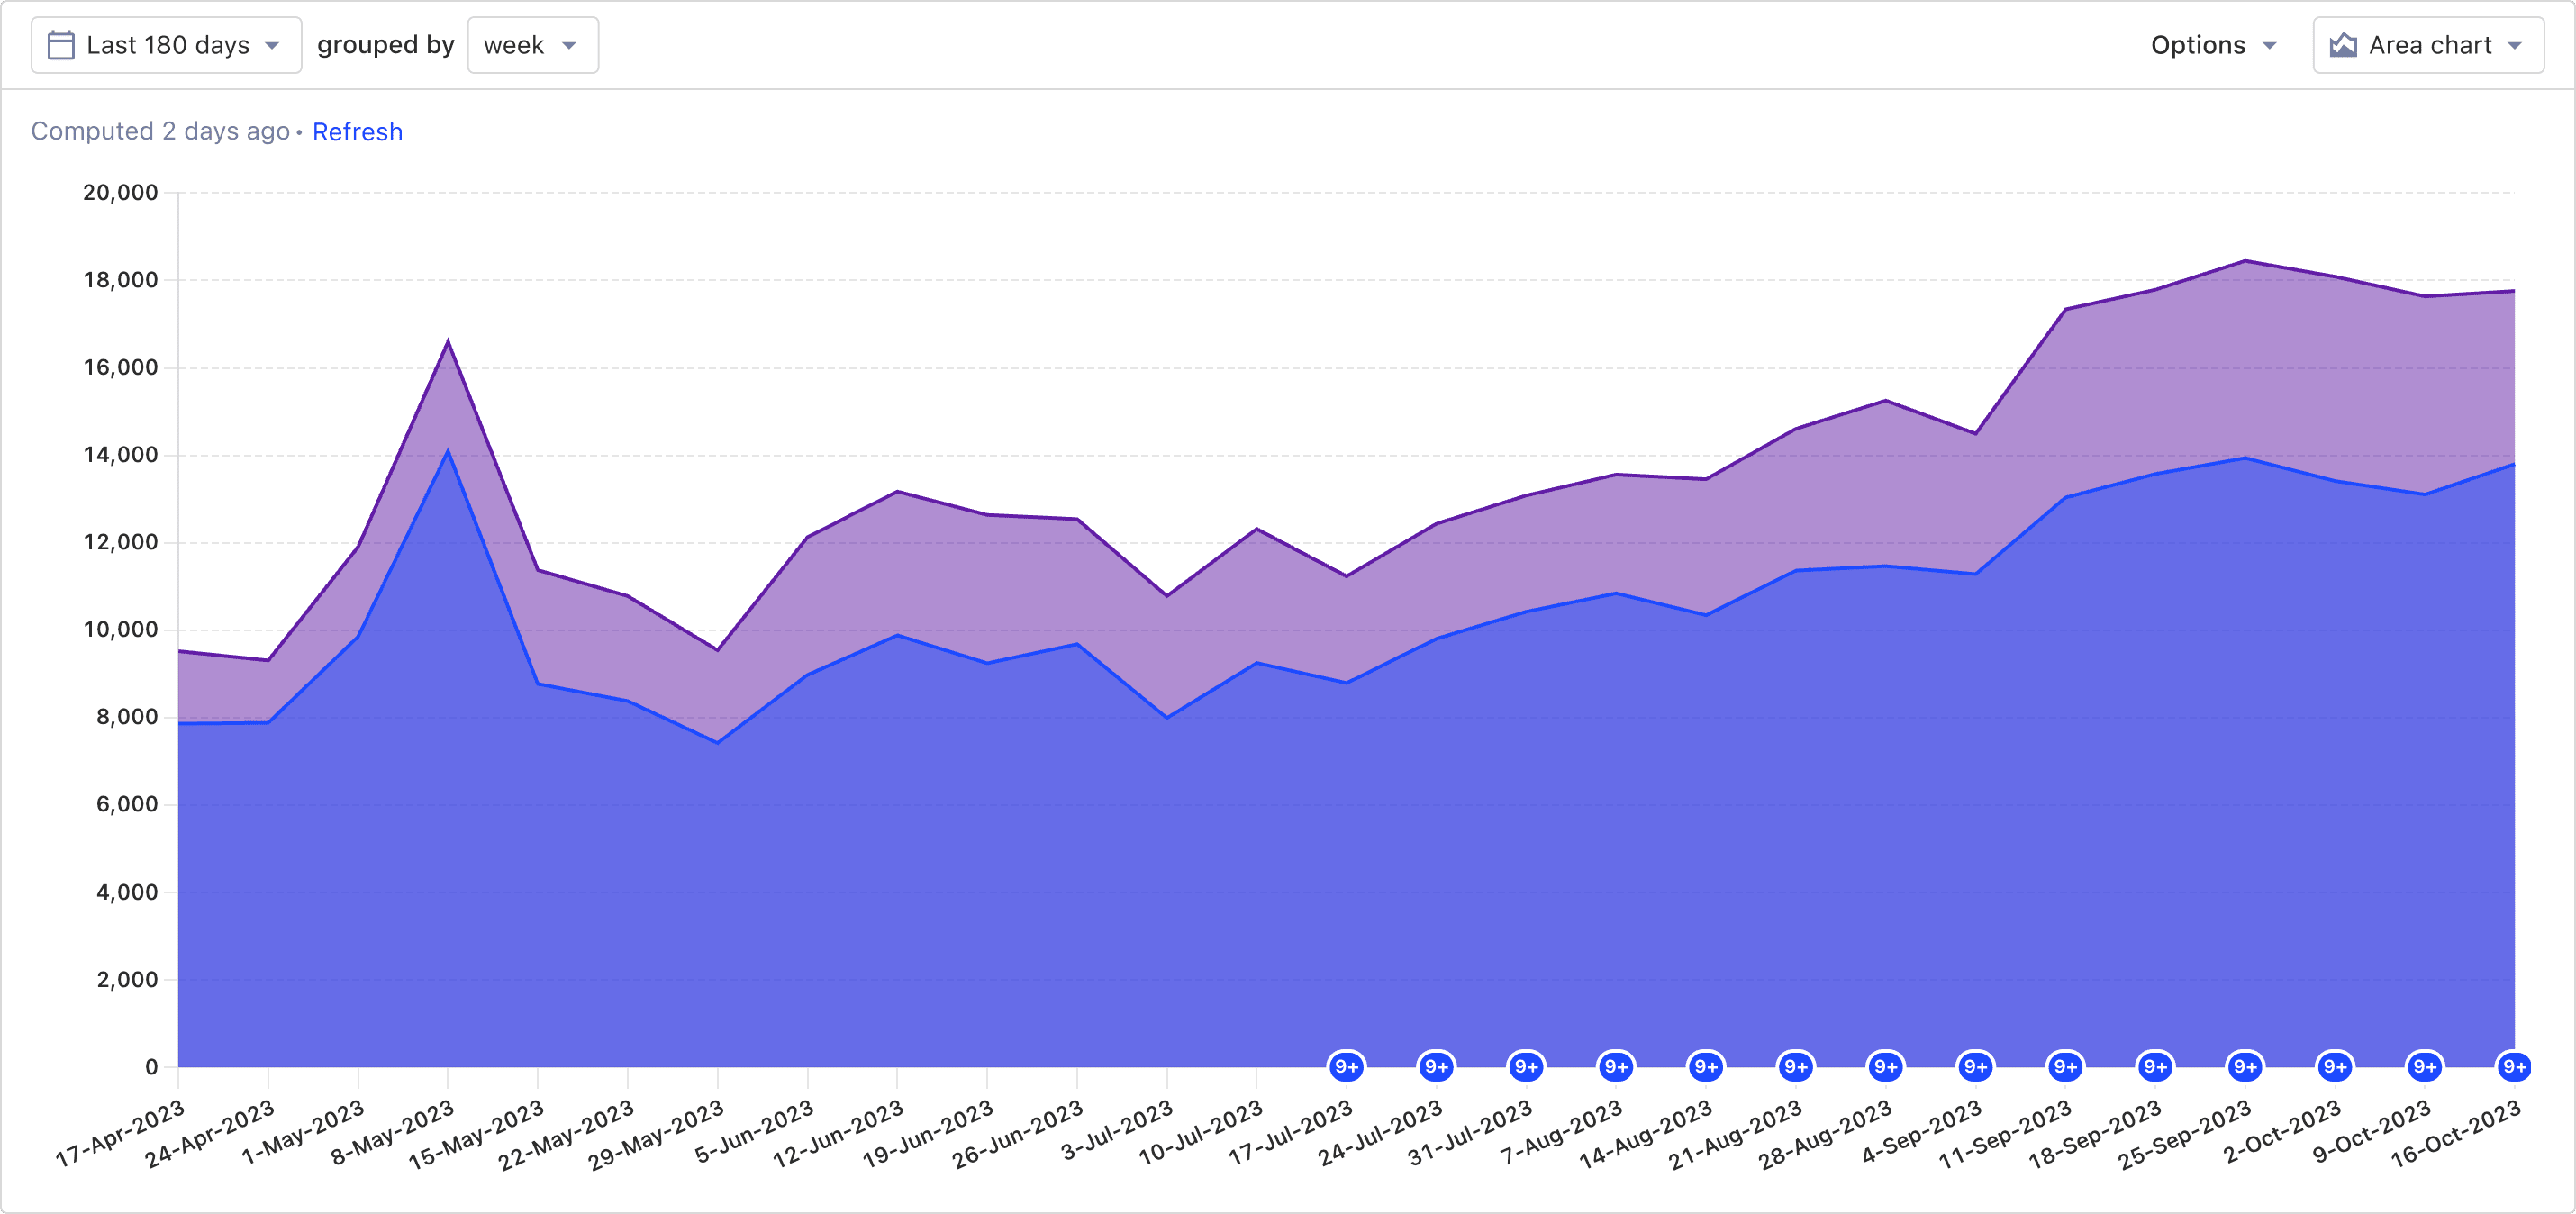
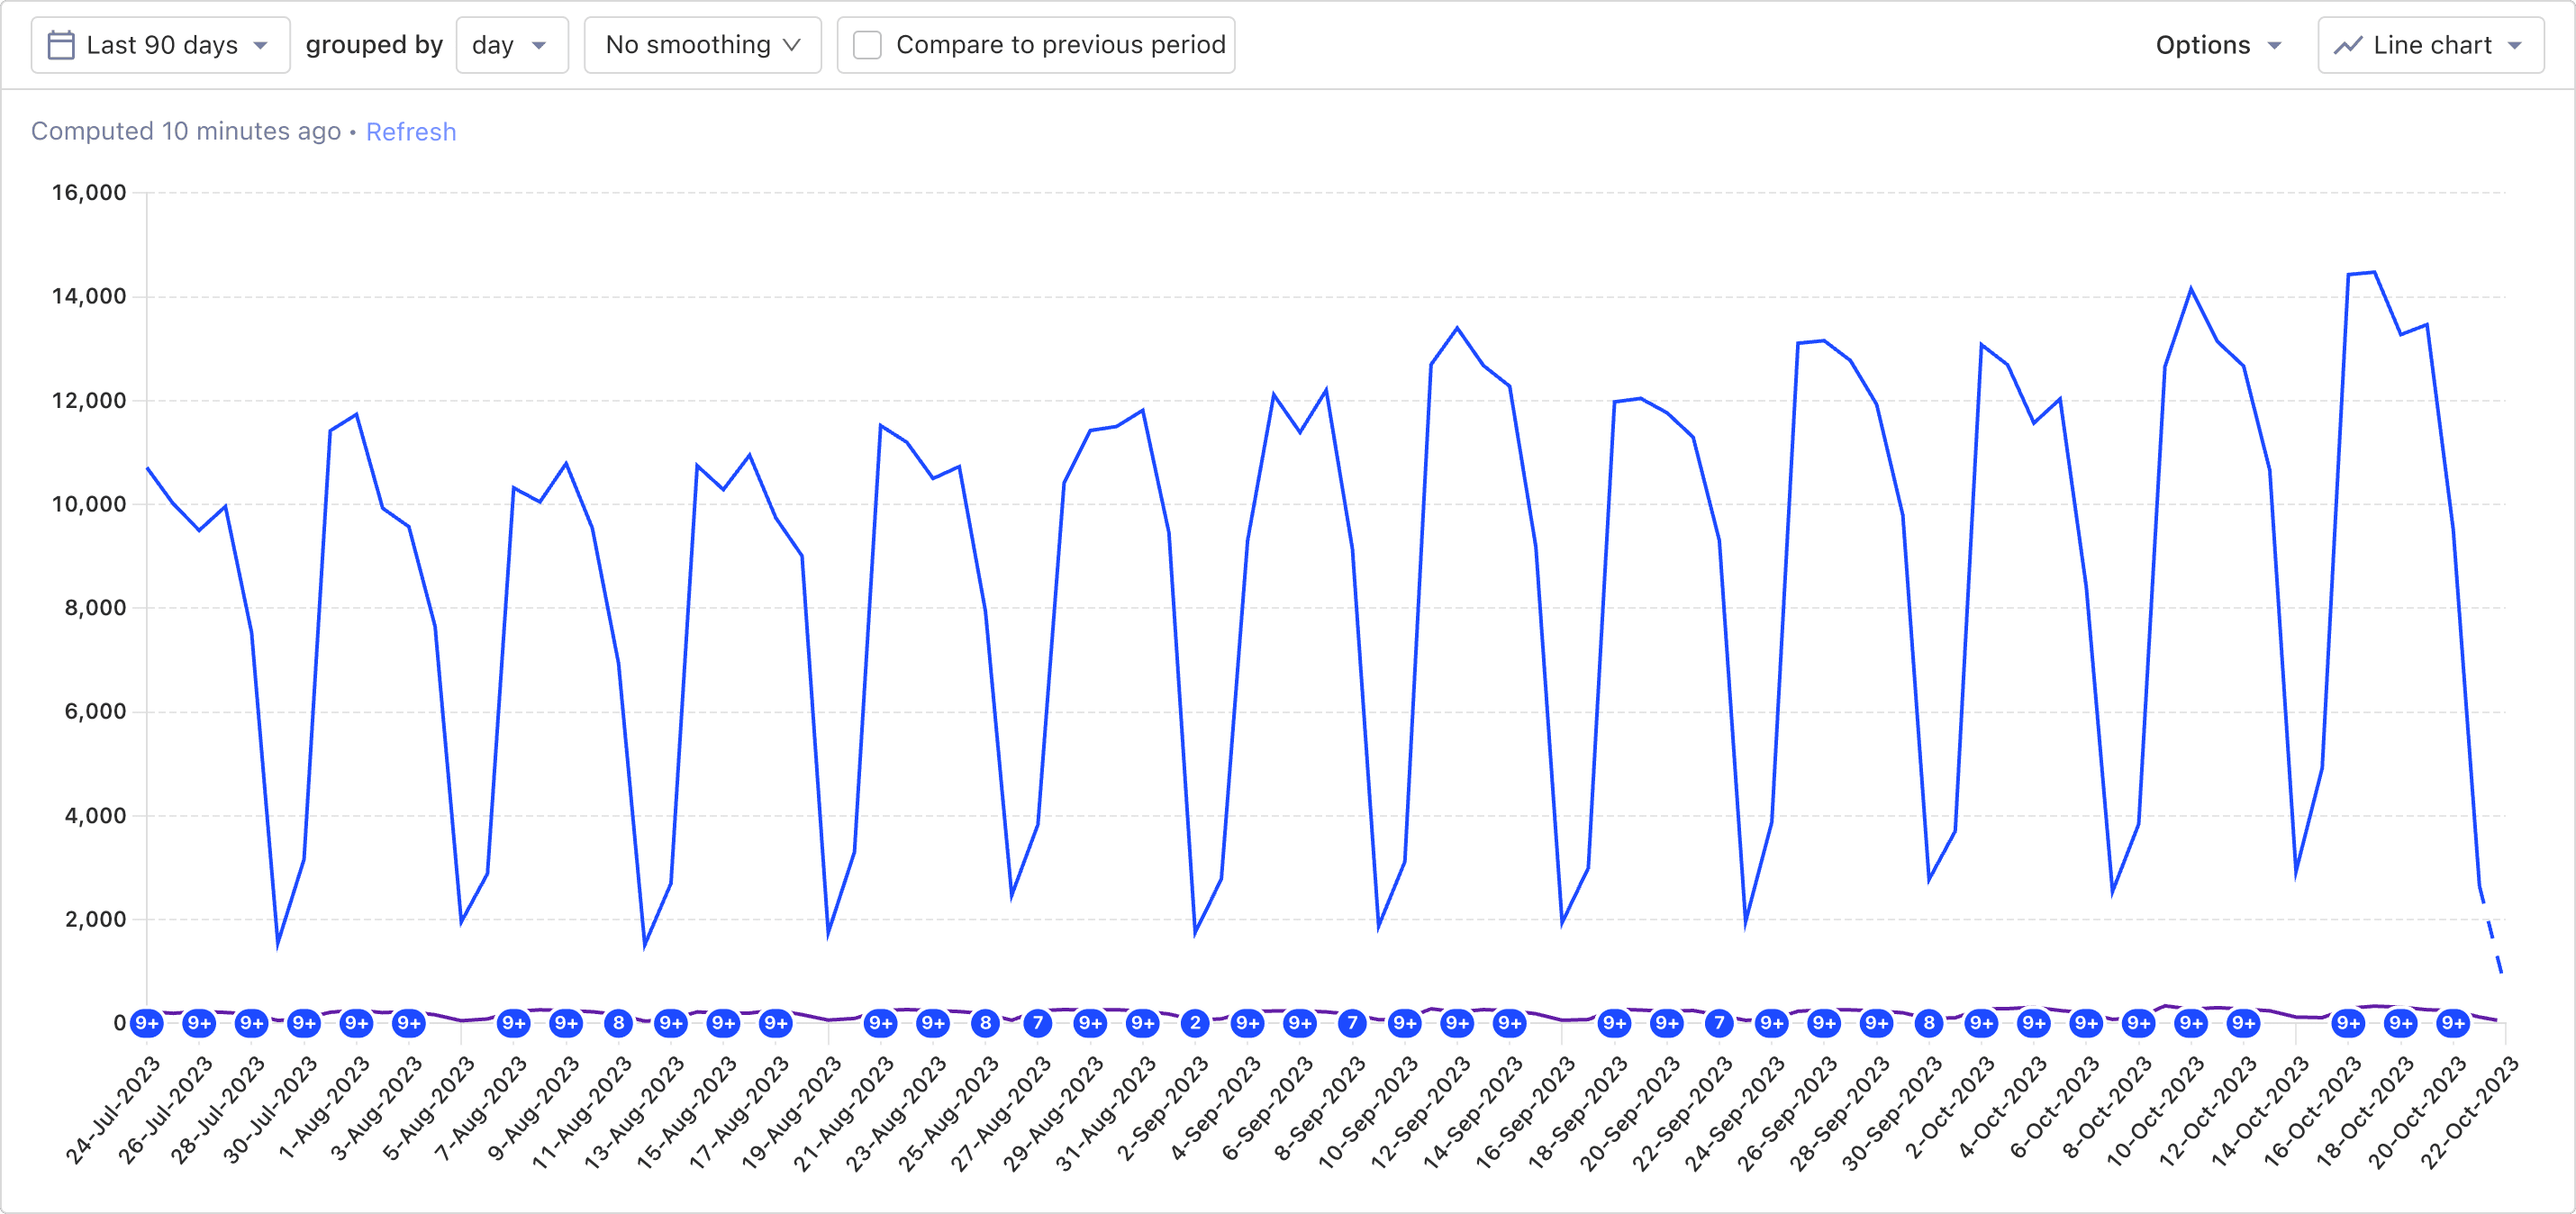
Plot events over time
Plot any event over time, such as a feature being used. You can even do math and multiple series.
Advanced filtering
Apply however many filters you need to or breakdown by any event, user or group property with advanced logic.
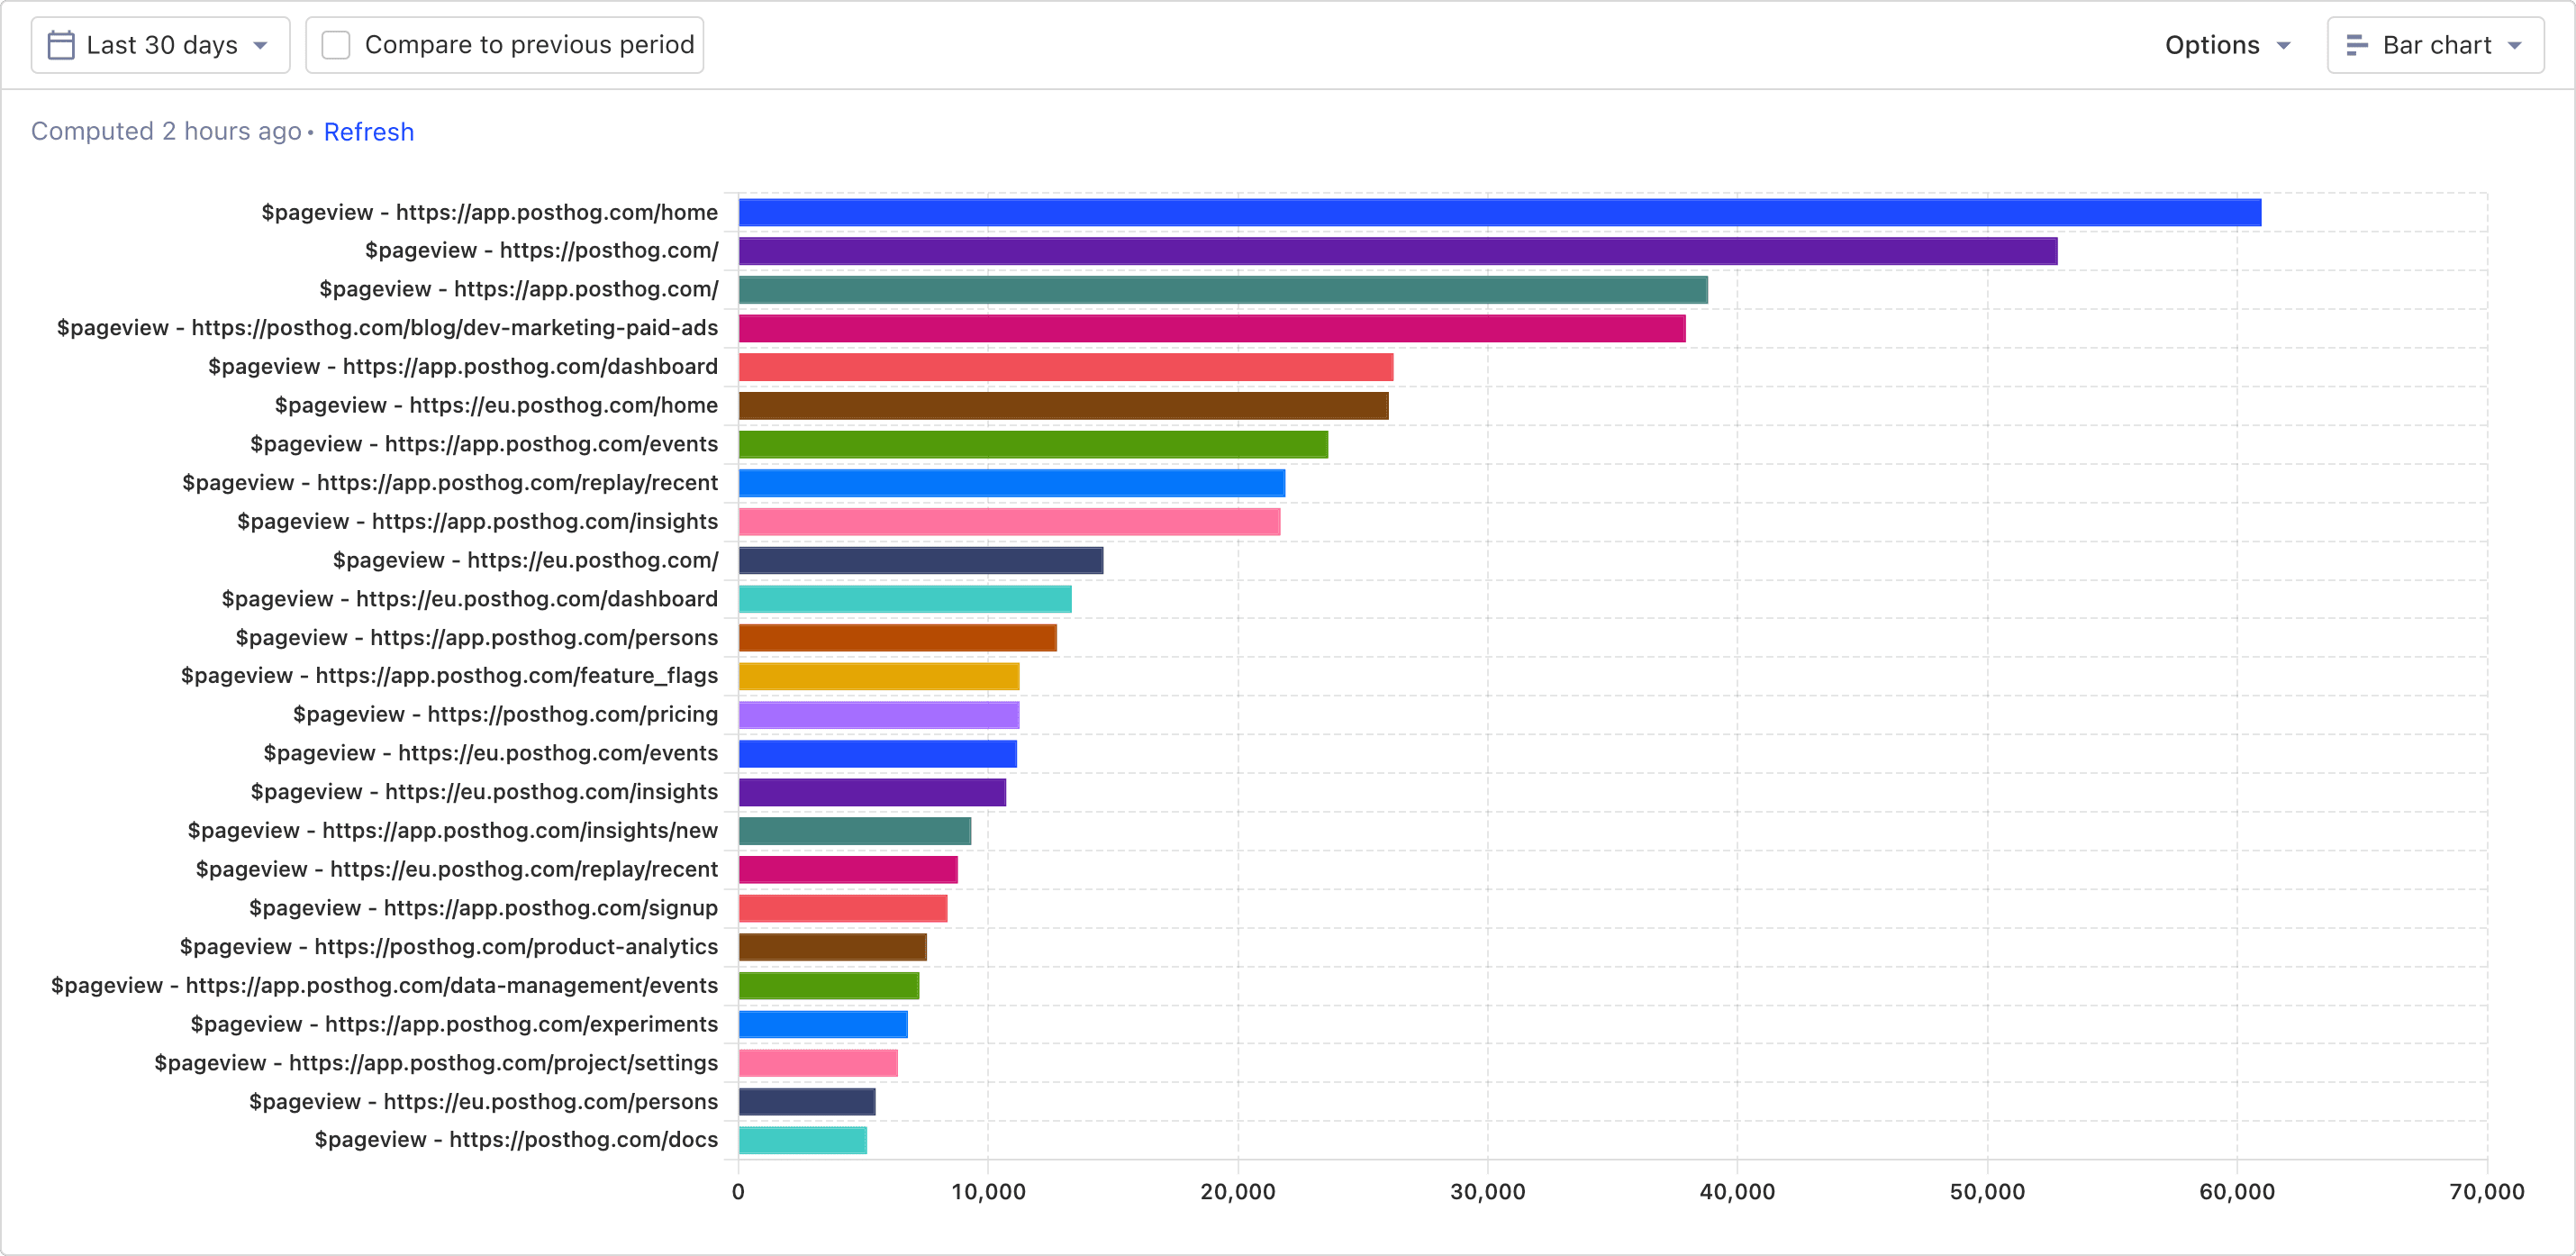
Breakdown tables
Break out your trends by any event property.
Speed up queries
Speed up long running queries across large datasets in one click.
PostHog is an all-in-one developer platform for building successful products. We provide product analytics, web analytics, session replay, error tracking,feature flags, experiments, surveys, LLM analytics, data warehouse, CDP, and anAI product assistant to help debug your code, ship features faster, and keep all your usage and customer data in one stack.