


Stickiness
Learn how many times users perform events in a period
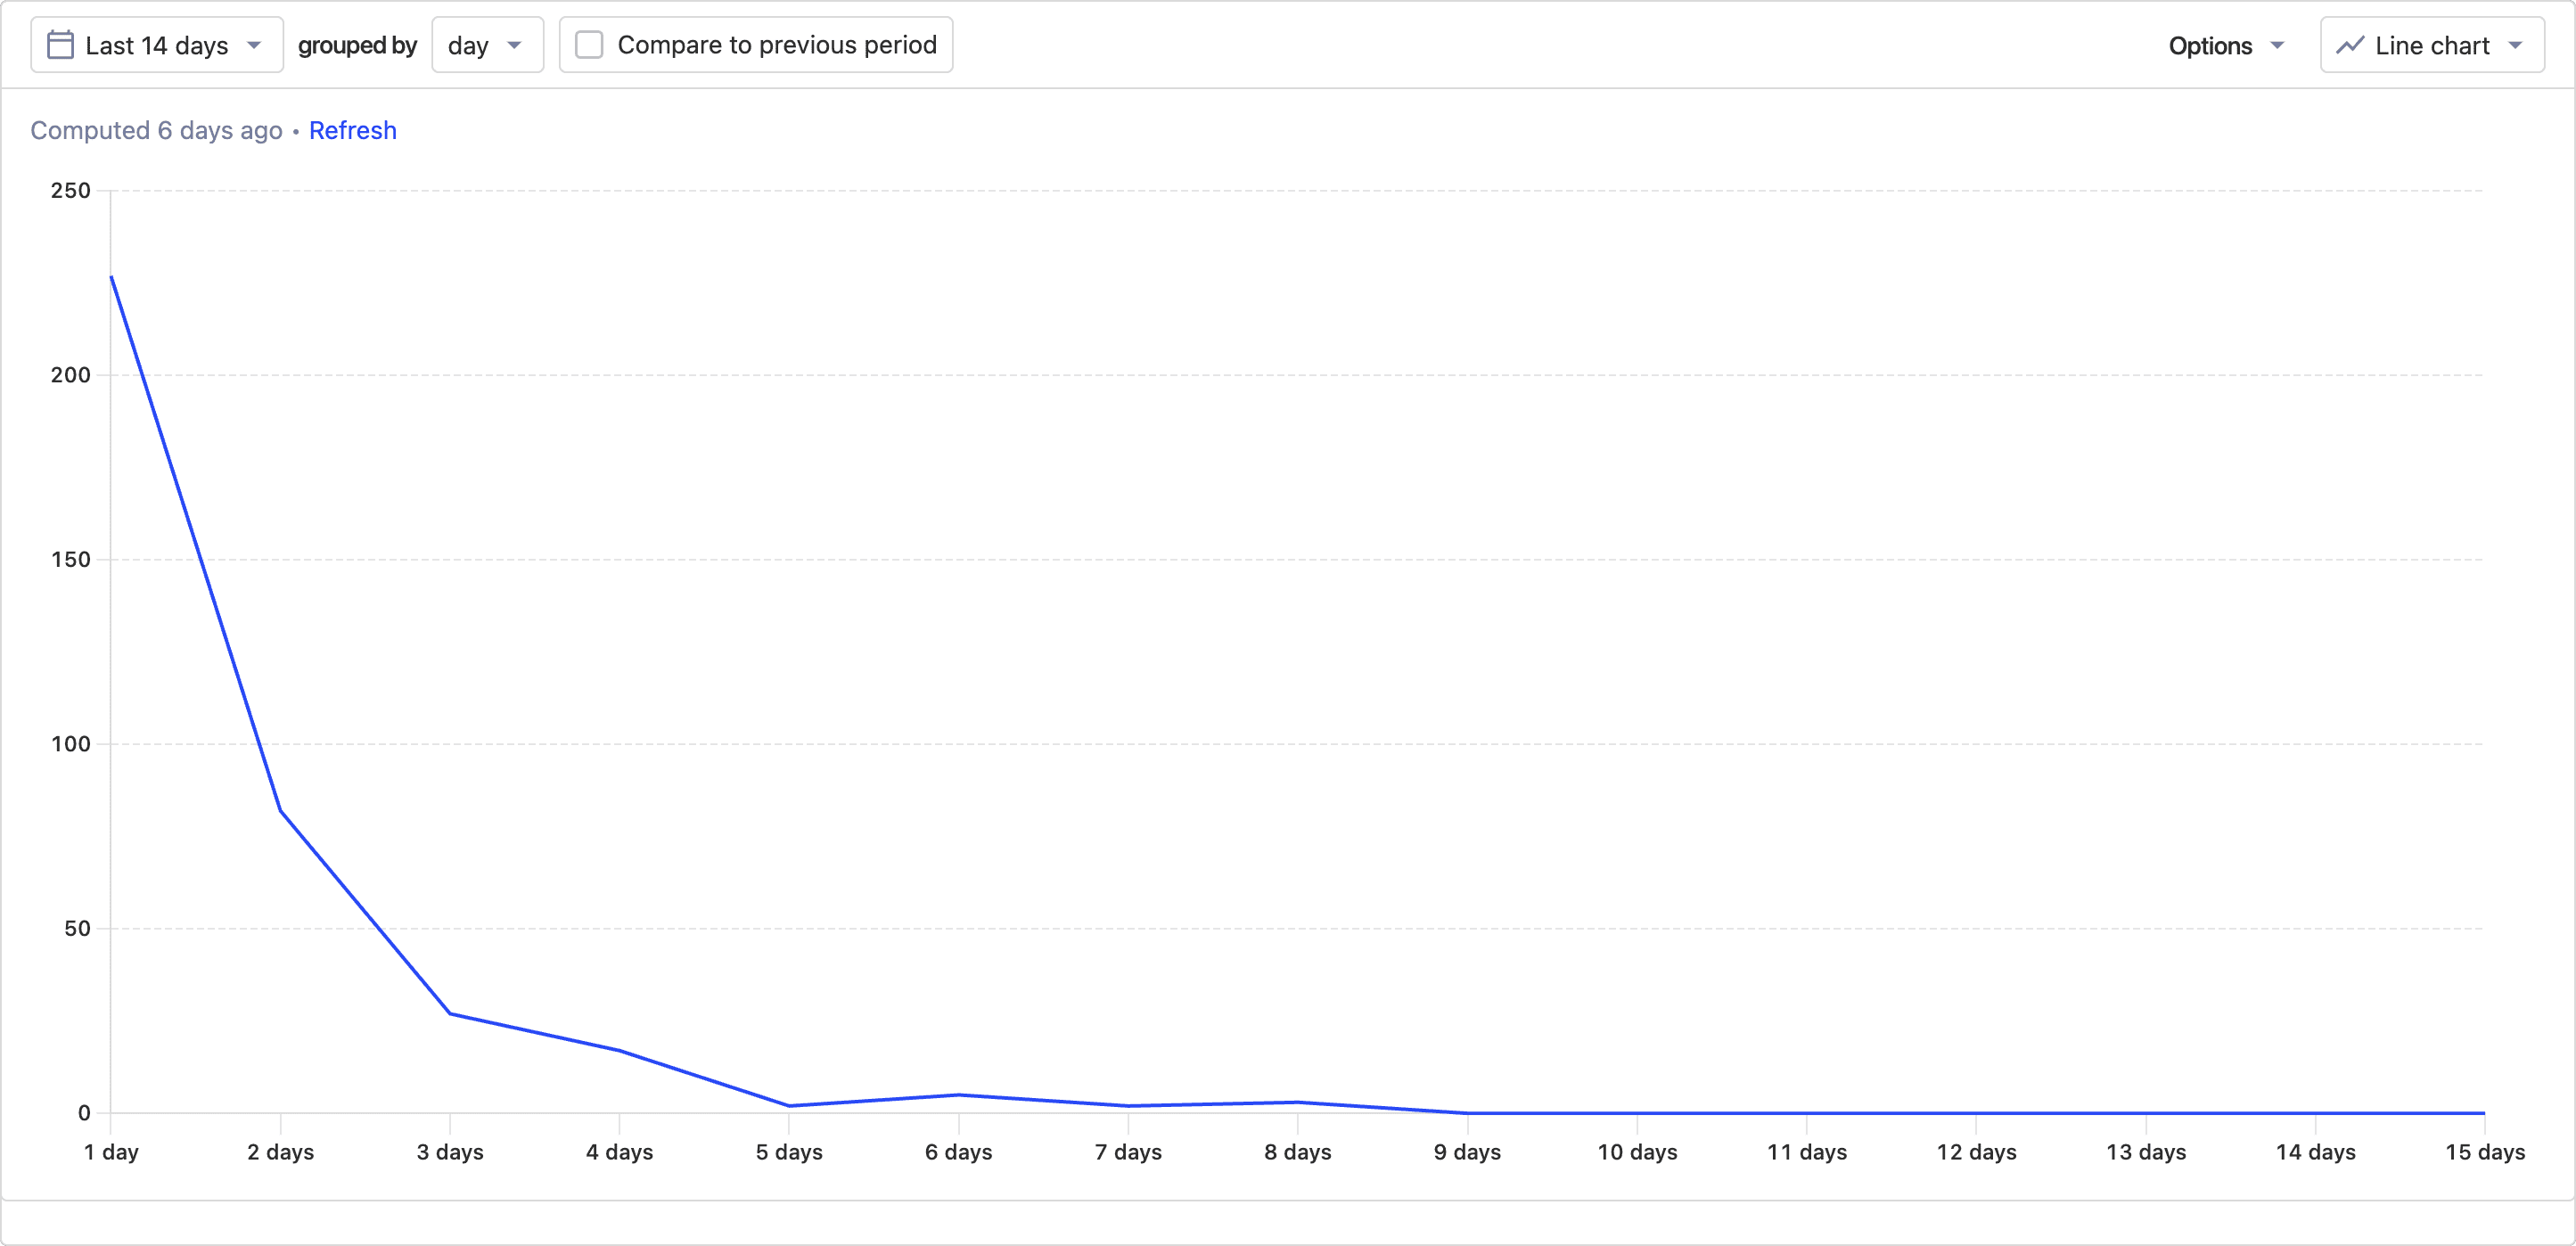
Understand user engagement frequency and identify your most active users by tracking how often they perform specific events.
Features
Frequency distribution
See the distribution of how often users perform specific actions.
Identify power users
Discover which users are most engaged with your product.
Engagement scoring
Quantify user engagement with stickiness metrics.
Time period analysis
Analyze stickiness over different time periods - daily, weekly, or monthly.
PostHog is an all-in-one developer platform for building successful products. We provide product analytics, web analytics, session replay, error tracking,feature flags, experiments, surveys, LLM analytics, data warehouse, CDP, and anAI product assistant to help debug your code, ship features faster, and keep all your usage and customer data in one stack.